
Minimization Visualization
This tutorial shows how to visualize energy minimization trajectories
using plt-min. You will produce energy profiles, 2D optimization
landscapes, and convergence panels.
Reference
The 2D projection method used here is described in:
R. Goswami, “Two-dimensional RMSD projections for reaction path visualization and validation,” MethodsX, p. 103851, Mar. 2026, doi:10.1016/j.mex.2026.103851.
Prerequisites
plt-min reads eOn minimization output: a movie file (multi-frame
.con), optionally a .dat compatibility/export log, and optionally the
final structure. Metadata-rich full CON frames are treated as the canonical
source of per-iteration metrics.
pip install rgpycrumbs # plot heavies via library AUTO_DEPS / ensure_import
The expected directory layout:
min_job/
  minimization   # multi-frame .con trajectory (movie file)
  minimization.dat  # (optional fallback/export) TSV: iteration, step_size, convergence, energy
  minimization.con  # (optional) explicit final structure
  min.con        # (optional legacy fallback) final minimized structure
The file prefix defaults to minimization but can be changed with --prefix
(e.g., --prefix qm_min for qm_min, qm_min.dat, qm_min.con). The
sidecar .dat file remains useful for inspection and backwards
compatibility, but the embedded CON metadata is the primary source. When an
explicit final structure is present, plt-min prefers <prefix>.con and then
falls back to legacy min.con.
Step 1: Energy Profile
The profile plot shows total energy vs iteration. A successful minimization shows monotonically decreasing energy converging to a plateau.
rgpycrumbs eon plt-min \
  --job-dir min_job/ \
  --plot-type profile \
  -o min_profile.pdf
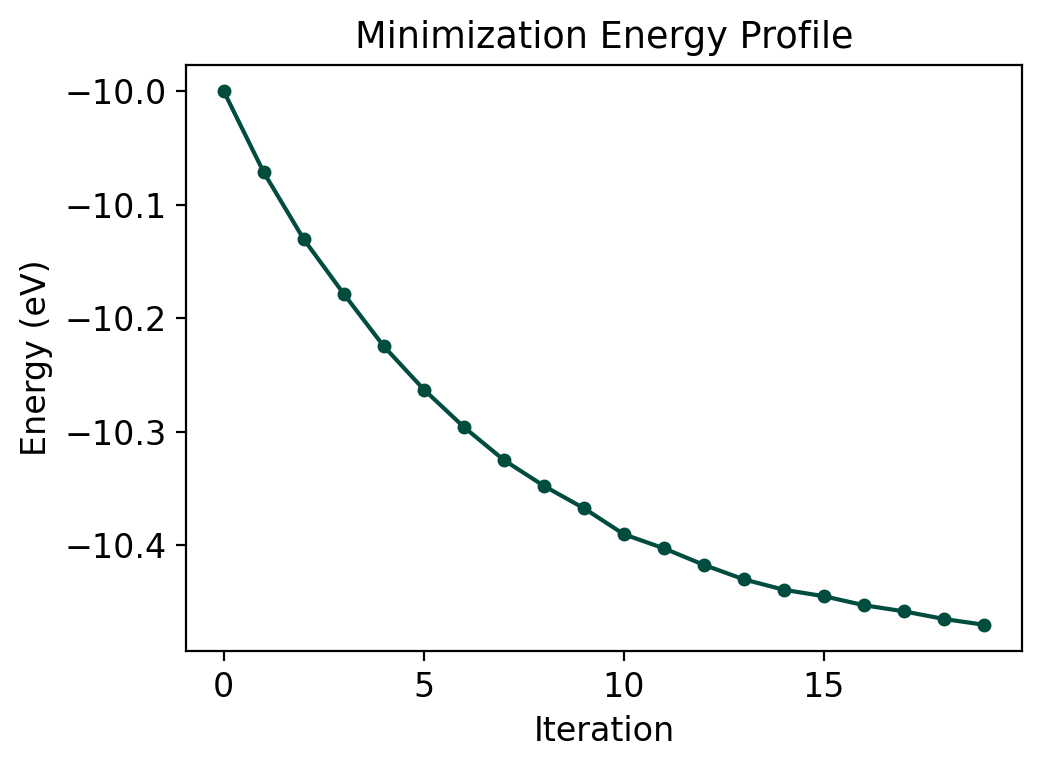
The exponential decay shape is typical for gradient descent minimization. The curve should flatten as forces approach zero.
Step 2: 2D Optimization Landscape
The landscape projects the trajectory into (s, d) coordinates:
s (progress): RMSD distance from initial to final structure
d (deviation): lateral displacement from the direct path
rgpycrumbs eon plt-min \
  --job-dir min_job/ \
  --plot-type landscape \
  --surface-type grad_matern \
  --project-path \
  -o min_landscape.pdf
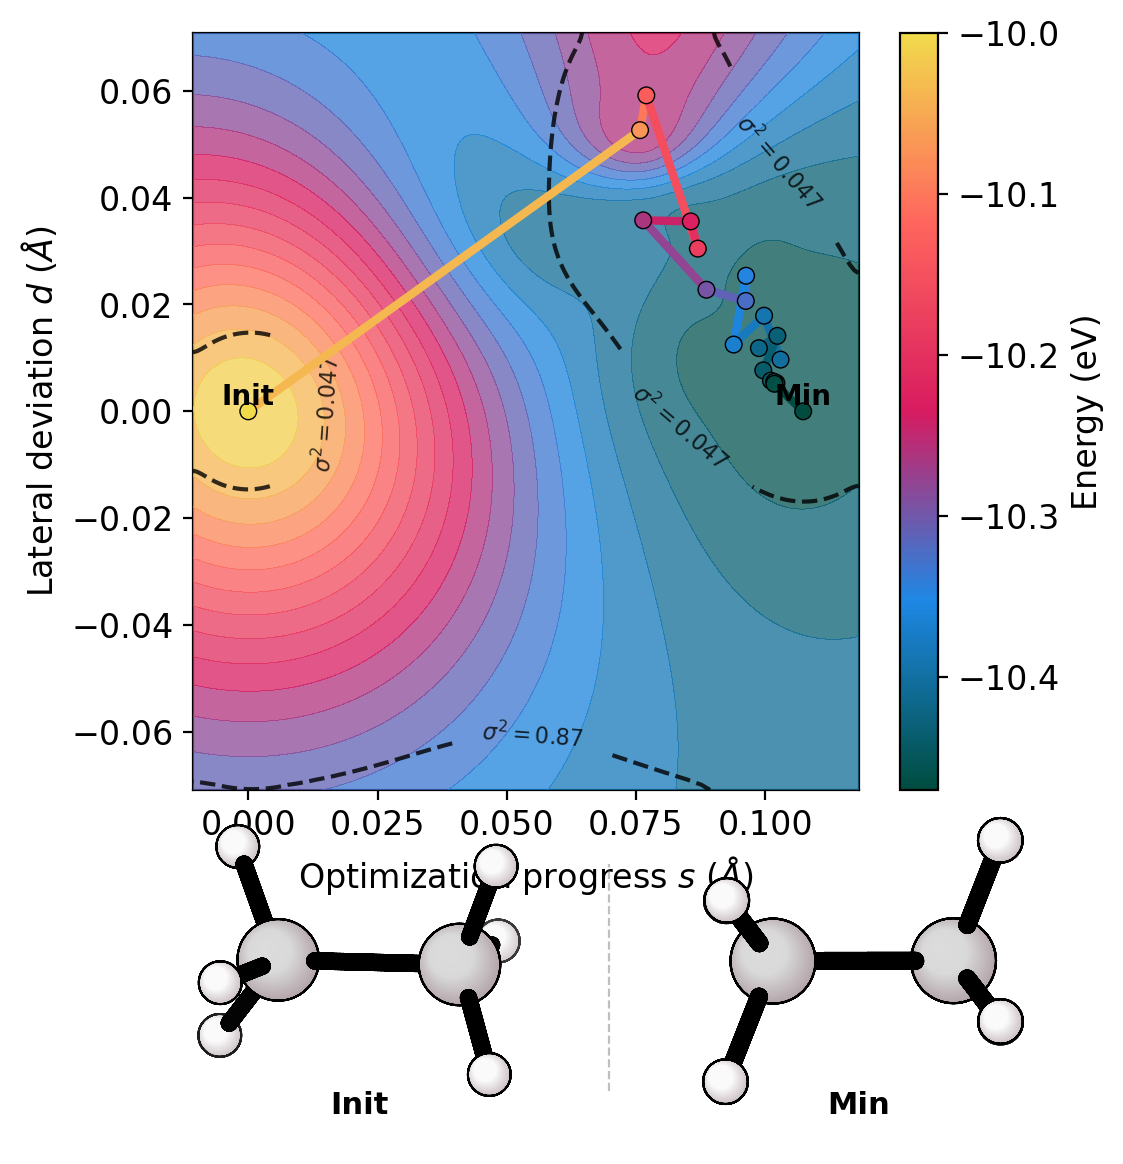
For a well-behaved minimization, the trajectory should follow the energy valley from the initial displaced geometry toward the minimum. Large lateral deviations indicate the optimizer is exploring off-pathway configurations.
Dense movies and TOML surface fit
eOn write_movies can record every force evaluation, so LBFGS paths may
exceed ~100 frames. GradientIMQ surfaces can then raise a non-finite
contourf error. Prefer a plot TOML over more CLI flags:
# plot.toml
[shared]
auto_thin = true
max_surface_points = 64

[min]
job_dir = ["min_job"]
plot_type = "landscape"
surface_type = "grad_imq"
output = "min_landscape.pdf"
rgpycrumbs eon plt-min --config plot.toml
auto_thin defaults to false (opt-in). When enabled, chemparseplot
subsamples the GP fit set only; the path scatter still shows the full
trajectory. See eOn plot TOML config.
Step 3: Convergence Panel
The convergence panel monitors the force norm and step size to diagnose optimization quality.
rgpycrumbs eon plt-min \
  --job-dir min_job/ \
  --plot-type convergence \
  -o min_convergence.pdf
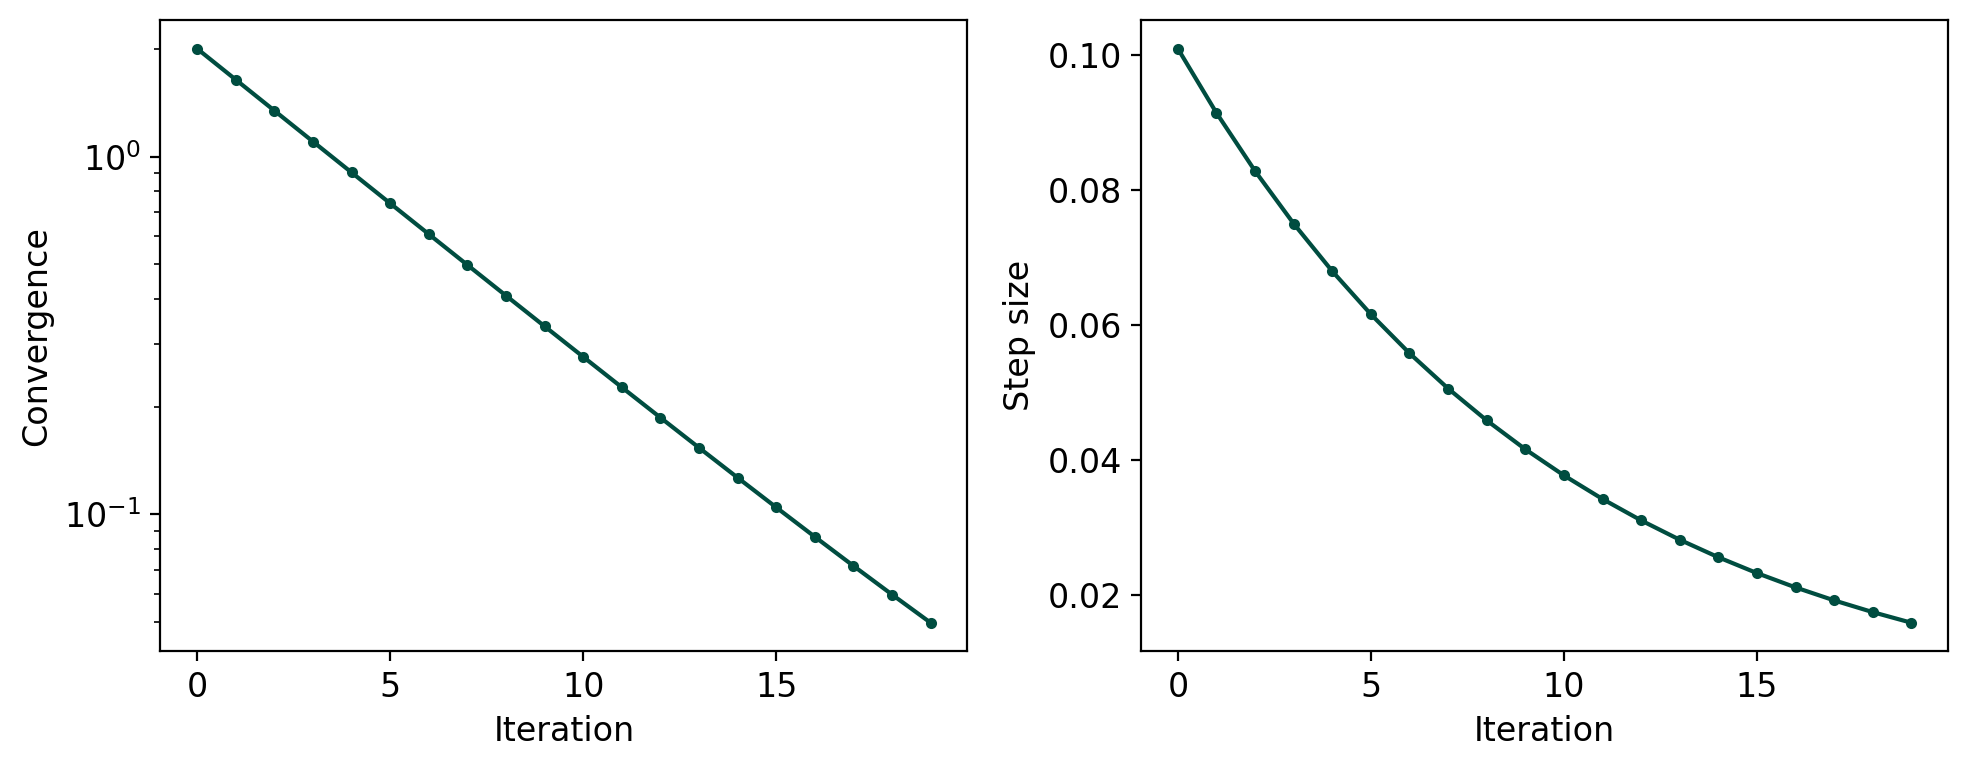
Both curves should decrease monotonically. Oscillations in the force norm suggest the step size is too large or the optimizer is struggling with the PES topology.
Custom File Prefix
eOn minimization jobs can use different prefixes depending on the job
type. Use --prefix to match:
# For jobs with qm_min, qm_min.dat, qm_min.con
rgpycrumbs eon plt-min --job-dir job/ --prefix qm_min --plot-type profile
Step 4: Comparing Optimizers
Use --job-dir multiple times to overlay trajectories from different
optimizers (FIRE, LBFGS, SD) on the same plot:
rgpycrumbs eon plt-min \
  --job-dir fire_min/ --label FIRE \
  --job-dir lbfgs_min/ --label LBFGS \
  --job-dir sd_min/ --label SD \
  --plot-type profile \
  -o optimizer_comparison.pdf
Each trajectory is plotted with a different color and appears in the legend. This works for profile, landscape, and convergence plots. On the landscape, the GP surface is fitted from the primary (first) trajectory, and all paths are overlaid.
# Convergence comparison
rgpycrumbs eon plt-min \
  --job-dir fire_min/ --label FIRE \
  --job-dir lbfgs_min/ --label LBFGS \
  --plot-type convergence \
  -o convergence_comparison.pdf
Summary
Feature |
Flag / TOML |
Notes |
|---|---|---|
Energy profile |
|
Energy vs iteration |
2D landscape |
|
GP surface fit |
Convergence |
|
Force + step size |
Multi-trajectory |
|
Overlay with legend |
Structure strip |
|
Init and Min below |
Custom prefix |
|
For non-default file names |
Projection toggle |
|
Default: on |
Dense-fit thin |
TOML |
Default off; not a CLI flag |
Plot suite config |
|
Preferred for many options |
See Also
Goswami, “Two-dimensional RMSD projections for reaction path visualization and validation,” MethodsX, p. 103851, Mar. 2026, doi:10.1016/j.mex.2026.103851